Dashboard

Contents
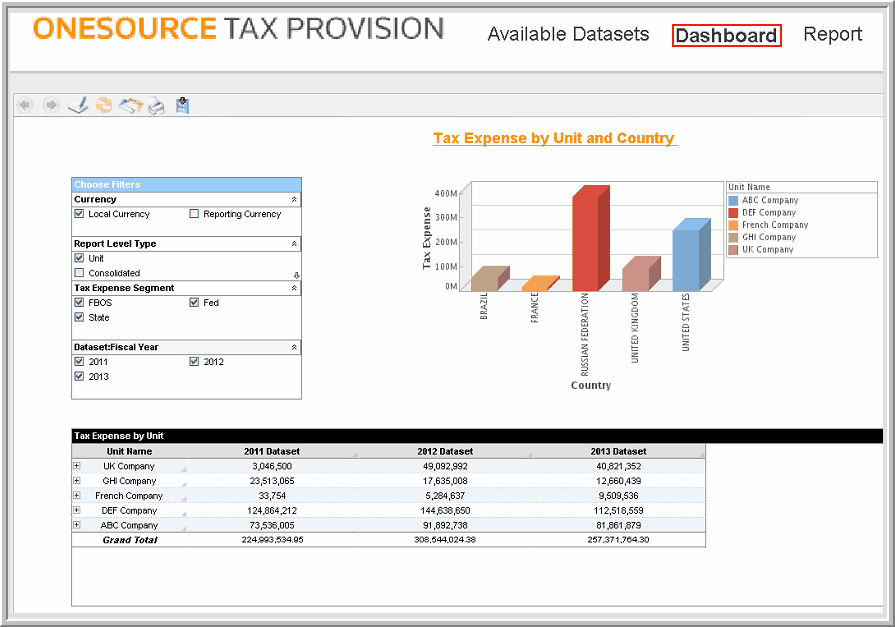
In Analysis, Dashboards provide a way to visualize data. Dashboards are created by the Designer and then assigned to End Users. You can view dashboards in the Dashboard page. If multiple dashboards are available, they appear in the list of tabs at the bottom of the page.
To open a Dashboard:
1.In the navigation bar, choose Analysis and the analysis page opens.
2.Select Dashboard at the top of the page to view your data.
3.At the bottom of the page, you can choose the tab with the dashboard in which to review. You can see this list of tabs only if multiple dashboards are available.
4.In the Dashboard page, you can select options to change the presentation of your data. You can adjust the dashboard settings (filtering selections, menu choices, annotations, and so forth) as desired to obtain the configuration that you want to save.
Dashboard
Note: If a Designer did not create and assign a dashboard to the Dashboard, by default the Report page opens. In the report page, End Users can see the Repository list and find assigned reports within the Shared Analysis folder. A Designer must create and assign reports, to the reports page, in order for them to appear in the reports page.